
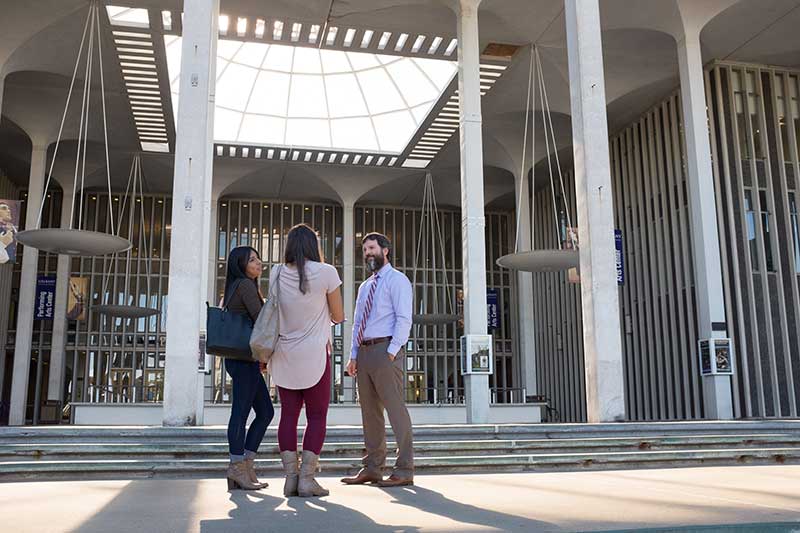
At UAlbany, you'll find the resources and experiences you need to succeed as a student and in your career. You’ll work closely with faculty mentors who are experts in their field, partners with industry contacts and published authors. And you'll study with a diverse group of students from around the globe, enriching your experience and opening you up to a world of new ideas.
UAlbany’s nine schools and colleges offer 60+ undergraduate majors and 150+ graduate programs.
We encourage you to also learn about our Honors College, Graduate School, AI & Society College, Microcredentials and Albany Law School Affiliation.
The College of Arts and Sciences is UAlbany’s largest academic unit and provides the liberal arts foundation for a UAlbany education.
Our students explore big ideas and timely, important problems; unleash their creativity and develop their aesthetic sensibility; investigate and analyze the natural world; and develop the flexible intellect required to be engaged local and global citizens.
The College of Arts & Sciences is home to the following departments:
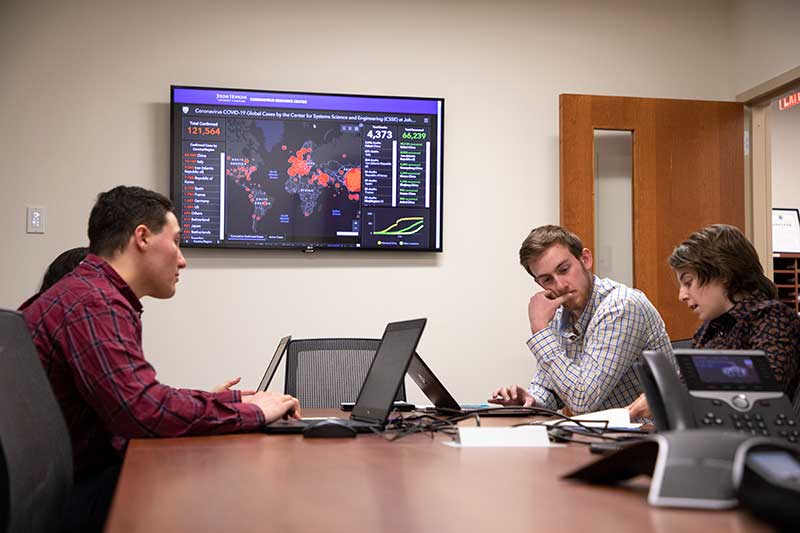
The College of Emergency Preparedness, Homeland Security & Cybersecurity (CEHC) revolves around making a difference. Dive into the dynamic work required to address global issues, build innovation and protect the nation with us.
CEHC provides high quality academic programs, blending an interdisciplinary and entrepreneurial spirit, fostering enthusiasm for learning and teaching, promoting operational application of knowledge, and leading cutting-edge research initiatives that bring together people, technology and knowledge to address the challenges of the 21st century.
CEHC is home to the following departments:
At the College of Integrated Health Sciences, social justice and health equity are deeply ingrained in our hands-on courses, innovative research and practice-based experience enhanced by our unique partnerships — including with the New York State Department of Health and over 475 other organizations and agencies.
Whether pursuing a career in public health, social welfare, biomedical sciences or nursing, our students’ ability to help communities will flourish as they gain practical knowledge and experience to improve well-being on local, national and global levels.
The College of Integrated Health Sciences is home to the following departments and units:

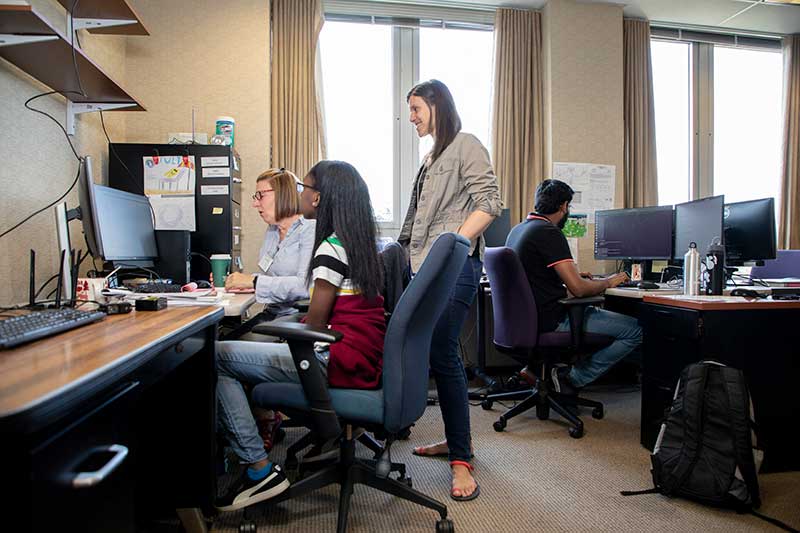
At the College of Nanotechnology, Science, and Engineering, we see engineering as science in service to society. Engineers are the professional innovators who couple science to the economy to build the national wealth and positively impact the quality of life for all.
Our students learn and grow in a comprehensive research university setting, among a diverse community of scholars who are committed to engineering and research excellence.
The College of Nanotechnology, Science, and Engineering is home to the following departments:
The Massry School of Business offers a high-quality business education, scholarly and applied research, innovative and distinctive niche programs, and experiential learning opportunities.
Thanks to our strong pipelines to the business community, our students have access to top executives in leading firms and most land job before graduation. Our alumni become a powerful network of leaders truly shaping the business world.

Rockefeller College of Public Affairs & Policy at the University at Albany is proud to be recognized by U.S. News & World Report as one of the top schools in the country. Talented students come to Rockefeller for the knowledge and tools to make a difference in the world.
Offering undergraduate, master's and doctoral level degree programs in public administration, political science, criminal justice and international affairs, as well as graduate certificate programs, we pride ourselves on preparing dynamic leaders who will shape the public policies of the future.
Rockefeller College of Public Affairs & Policy is home to the following schools and departments:
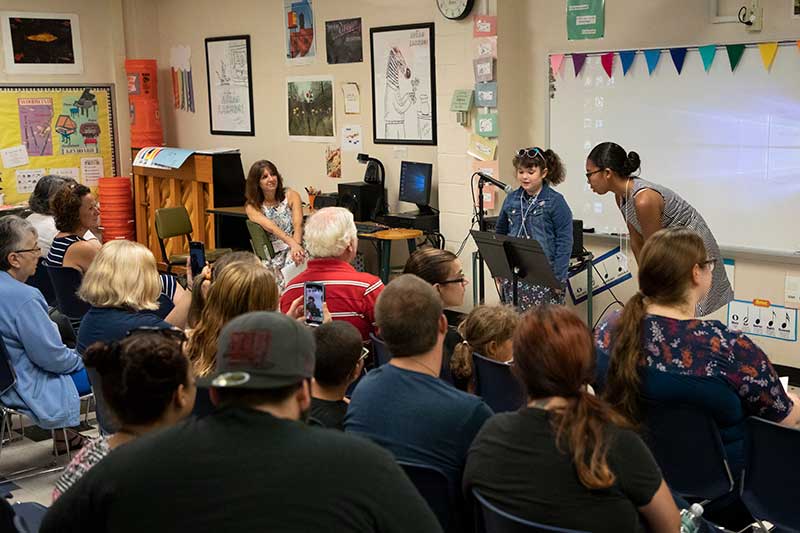
The School of Education's nationally ranked and accredited programs are springboards to outstanding careers in numerous fields. Our mission is to enhance learning and human development, in and out of classrooms.
Our students participate in a community of scholarship with a legacy of enhancing education and mental health in New York State and the nation, fulfilling our commitment to serve the needs of educators and counselors around the world.
The School of Education is home to the following departments: