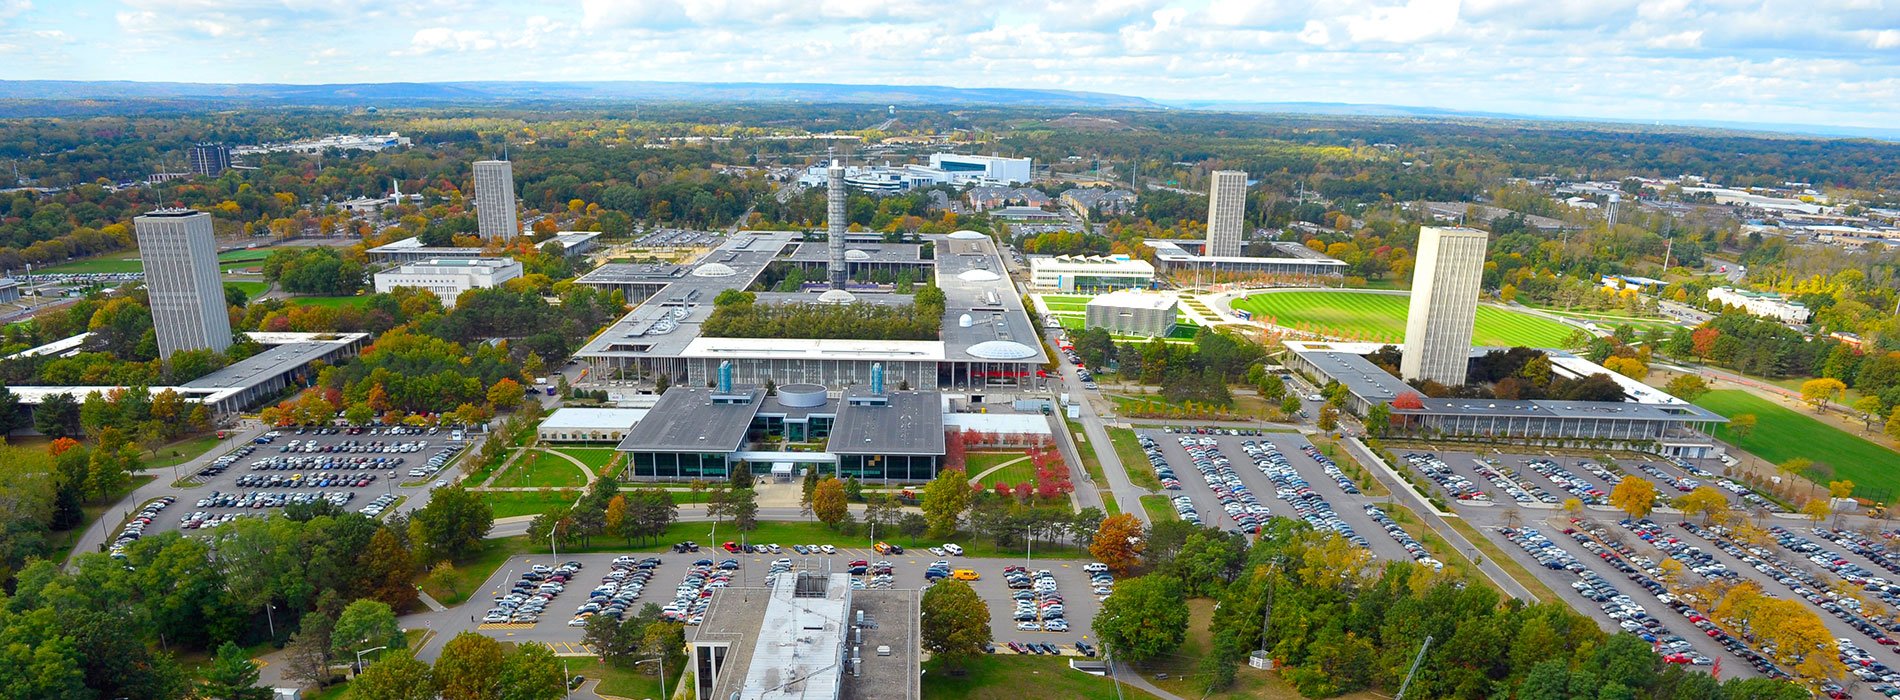
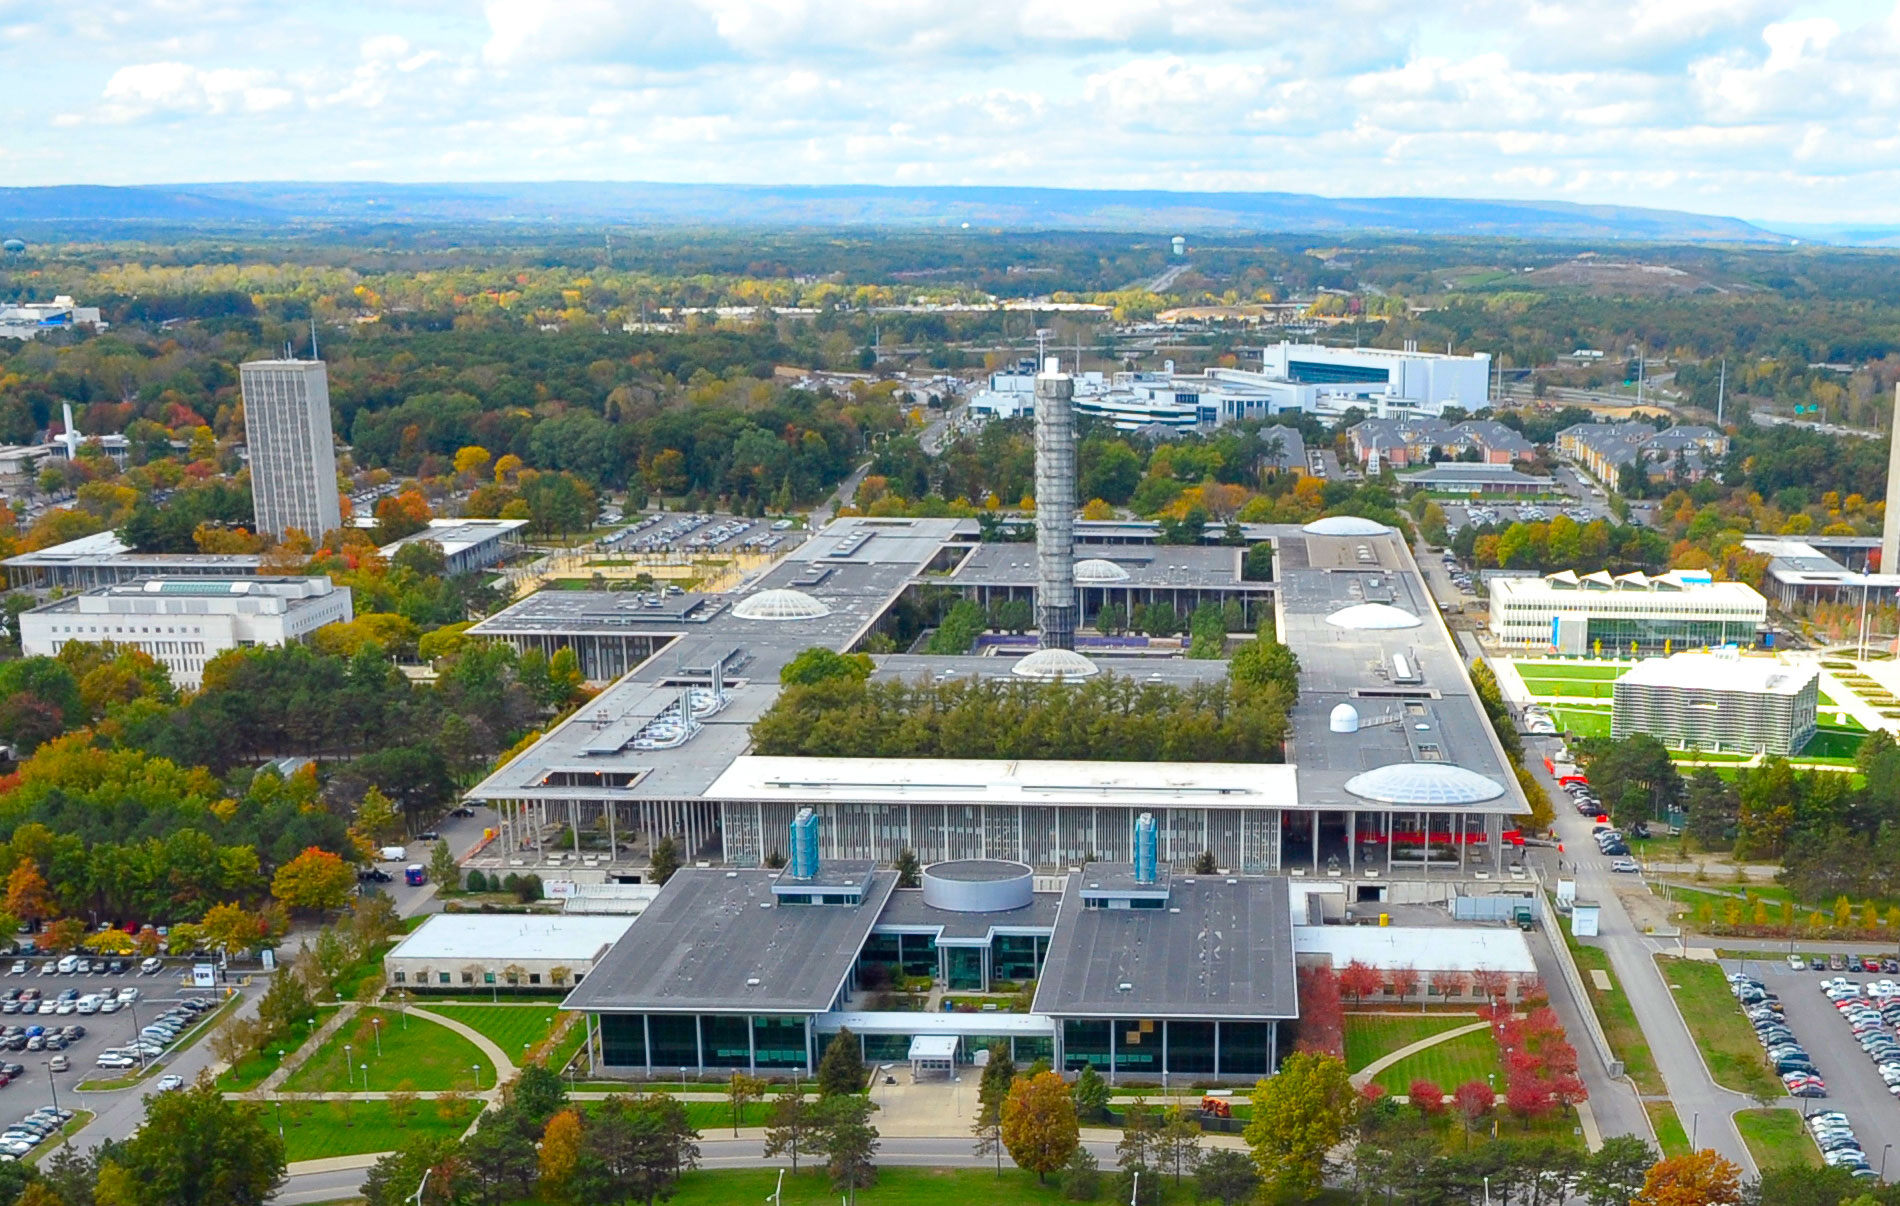


The Center for Functional Genomics is located at the University at Albany, SUNY in Albany, New York. The laboratory is located on the first floor of the Life Sciences Research Building.
The CFG provides basic laboratory services to hundreds of bioscience researchers at companies, universities, and government agencies around the world, helping them create robust, reliable results quickly and affordably.
We handle projects of any size, from single sample analyses to long-term work as collaborators or subcontractors on NIH grants. Each client is assigned a Ph.D.-level scientist to coordinate their project, meeting budget and deadline needs.
The services available at CFG are offered on a fee-for-service basis to commercial and educational organizations. A list of selected clients can be found here
For more information about our research or the Center, please email us at [email protected]
CFG core laboratories provide services to the research community on a fee-for-service basis. These services are available to investigators at the University at Albany, other academic institutions, and commercial entities.
Microarray and Next Gen Sequencing
The core provides NextGen sequencing services on the Illumina NextSeq 2000 and Oxford Nanopore MinION platforms. Custom services for gene expression analysis using the Affymetrix GeneChip technology are also offered. Instrumentation for Agilent arrays and two-color experiments are also available.
DNA Sequencing & Fragment Analysis
The CFG utilizes Applied Biosystems' 3730XL DNA analyzer for sequencing and fragment analysis. CFG offers DNA sequencing services for a wide range of templates including plasmid DNA, PCR fragments, cosmid DNA, and bacterial genomic DNA.
Fragment analysis can be performed with the ABI DS33 dye set (6-FAM, VIC, NED, PET, and LIZ).
Quantitative PCR Services
The CFG utilizes Applied Biosystems' QuantStudio 12K Flex instrument to perform qPCR experiments. Available formats include 96 and 384 well plates, and Open Array.
Human Cell Line Authentication
The CFG DNA sequencing facility performs human cell line authentication by short tandem repeat (STR) profiling.
1400 Washington Avenue
Albany, NY 12222
United States