MANAGEMENT ACCOUNTING
CONCEPTS AND TECHNIQUES
By Dennis Caplan, University
at Albany (State University of New York)
�CHAPTER 4:� Cost Behavior
Chapter Contents:
- Introduction
- Variable costs
- Fixed costs
- Relevant range
- Mixed costs
- Cost behavior assumptions in management accounting versus microeconomics
- Exercises and problems
Introduction:
The most important building block of both microeconomic analysis and cost accounting is the characterization of how costs change as output volume changes. Output volume can refer to production, sales, or any other principle activity that is appropriate for the organization under consideration (e.g.: for a school, number of students enrolled; for a health clinic, number of patient visits; for an airline, number of passenger miles). The following discussion examines the volume of production in a factory, but the same principles apply regardless of the type of organization and the appropriate measure of activity.
Costs can be variable, fixed, or mixed.
Variable Costs:
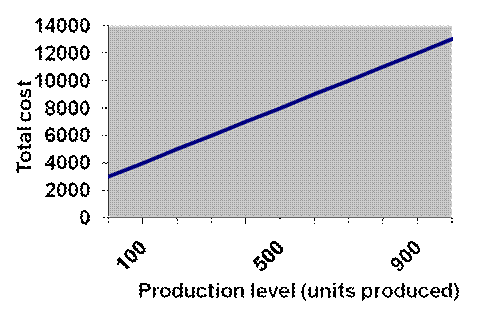
Variable costs vary in a linear fashion with the production level. However, when stated on a per unit basis, variable costs remain constant across all production levels within the relevant range. The following two charts depict this relationship between variable costs and output volume.
.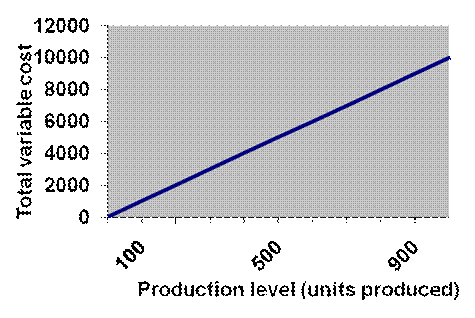
A good example of a variable cost is materials. If one pair of pants requires $10 of fabric, then every pair of pants requires $10 of fabric, no matter how many pairs are made. The fabric cost is $10 per unit at every level of production. If one pair is made, the total fabric cost is $10; if two pairs are made, the total fabric cost is $20; and if 1,000 pairs are made, the total fabric cost is $10,000. Hence, the total cost is increasing and linear in the production level.
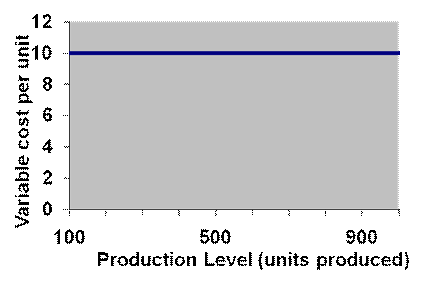
Fixed Costs:
Fixed costs do not vary with the production level. Total fixed costs remain the same, within the relevant range. However, the fixed cost per unit decreases as production increases, because the same fixed costs are spread over more units. The following two charts depict this relationship between fixed costs and output volume.
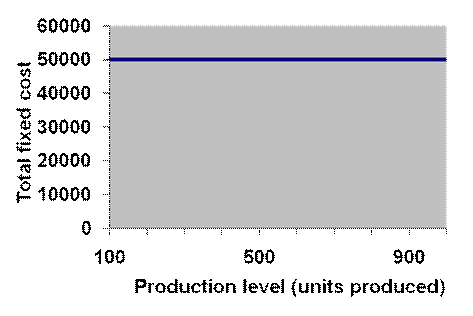
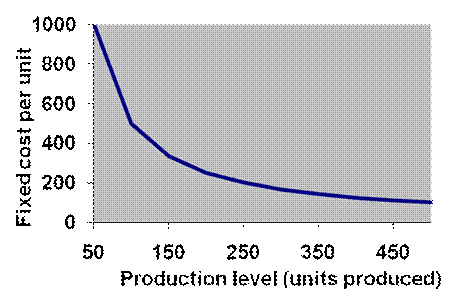
In this example, fixed costs are $50,000. The first chart shows that fixed costs remain $50,000 at all production levels from 100 units to 1,000 units. The second chart shows that the fixed cost per unit decreases as production increases. Hence, when 100 units are manufactured, the fixed cost per unit is $500 ($50,000 � 100). When 500 units are manufactured, the fixed cost per unit is $100 ($50,000 � 500).
Relevant Range:
The relevant range is the range of activity (e.g., production or sales) over which these relationships are valid. For example, if the factory is operating at capacity, increasing production requires additional investment in fixed costs to expand the facility or to lease or build another factory. Alternatively, production might be reduced below a threshold at which point one of the company�s factories is no longer needed, and the fixed costs associated with that factory can be avoided. With respect to variable costs, the company might qualify for a volume discount on fabric purchases above some production level. The relevant range for characterizing fabric as a variable cost ends at that production level, because the fabric cost per unit of output is different when the factory produces above that threshold than when the factory produces below that threshold.
Mixed Costs:
If, within a relevant range, a cost is neither fixed nor variable, it is called semi-variable or mixed. Following are two common examples of mixed costs.
In this example, although the total cost line increases in production, it does not pass through the origin because there is a fixed cost component. An example of a cost that fits this description is electricity. A fixed amount of electricity is required to run the factory air conditioning, computers and lights. There is also a variable cost component related to running the machines on the factory floor. The fixed component in this example is $3,000 per month. The variable cost component is $10 per unit of output. Hence, at a production level of 500 units, the total electric cost is $8,000 [$3,000 + ($10 x 500)].
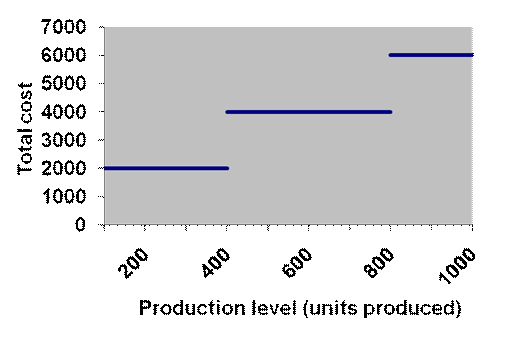
The mixed cost illustrated in the above chart is called a step function. An example of such cost behavior would be the total salary expense for shift supervisors. If the factory runs one shift, only one shift supervisor is required. In order for the factory to produce above the maximum capacity of a single shift, the factory must add a second shift and hire a second shift supervisor, so that total shift supervisor salary expense doubles. If the factory runs three shifts, three shift supervisors are required.
Cost Behavior Assumptions in Management
Accounting Versus Microeconomics:
Microeconomic analysis usually assumes decreasing marginal costs of production, sometimes followed by increasing marginal costs of production beyond a certain production level. Hence, economists� graphs of the total cost of production and the average per-unit cost of production show smooth, curved functions. Management accountants usually assume the linear relationships depicted in the previous graphs. Linearity is a more accurate description of many situations encountered by management accountants than the economists� curves, and even when linearity constitutes a simplifying assumption it is almost always sufficiently descriptive for the task at hand.��
Go to the
End-of-Chapter Exercises and Problems
Return
to the Table of Contents
Management
Accounting Concepts and Techniques; copyright 2006; most recent update:
November 2010
For a printer-friendly version, contact Dennis Caplan at [email protected]