|
|
 |
|
Life time of a Muon
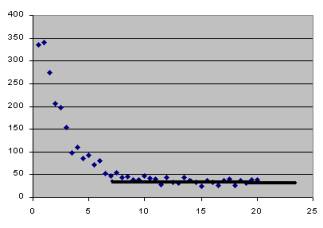
The data provided here is a "cleaned-up" version of data taken by Ed Pascuzzi in the summer of 2000. He recorded muon double hits and, using MS Excel, put them into time bins of width 0.5 microseconds. As muons decay, the number of muons decreases as the time increases. Your job is to take and analyze this data to find the lifetime of the muon using the following steps: Procedure: 1. Using MS Excel Plot the data table mounlifet.xls. Select scatter plot. 2. How does this compare to the twizzler graph? 3. From your graph determine the level of background. This is done by observing the position where the graph appears to be a horizontal line. Find the time at which the plot becomes horizontal and go to your spreadsheet (See example below). Find the average of all the data points from this time to the end of your data. This is the background value to be subtracted from the double hit data column. 4. Graph the background adjusted data selecting the range from time 0 seconds to the time at which the plot became horizontal. 5. After plotting the corrected data, fit the data to an exponential N = Noe-t/T and use the curve fit information to find T, the muon lifetime.
For further reading on the background for this experiment go to , Muon Lifetime.
Figure1
|
|
[Albany Quarknet] [Experiments] [Tizzler Decay] [Soda] [RC Circuit] [Muon Lifetime] [Cosmic Muons] |