The Effect of the Central Limit
Theorem on die-rolls:
Ok, what I've done here is used EXCEL to generate thousands of rolls of a
fair die. That is, a die that's as likely to come up 1 as 2 as 3 etc.
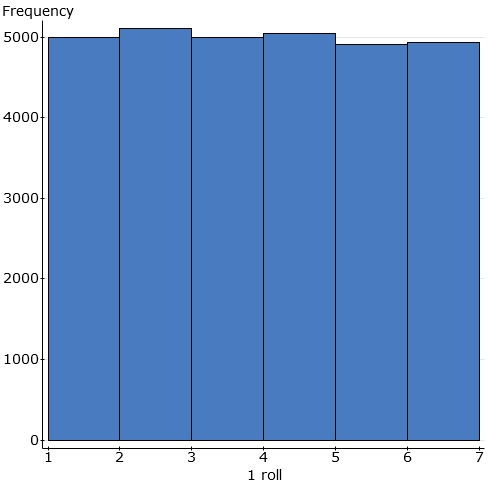
My parent population, the population from which I'm drawing, is thus "all
possible rolls of a fair die". This is six bars all the same
height. 1/6 of all possible rolls will be 1, 1/6 will be 2's, etc.
Samples of size 1: I'm doing 1 roll of a fair die to
produce "the average of 1 roll", that is, the roll itself. I
repeat for several thousand "samples of size 1" and use Statcrunch to
display the results:
Samples of size 2: I'm doing 2 rolls of a fair die to produce "the average of 2 rolls". I repeat for several thousand "samples of size 2" and use Statcrunch to display the results:
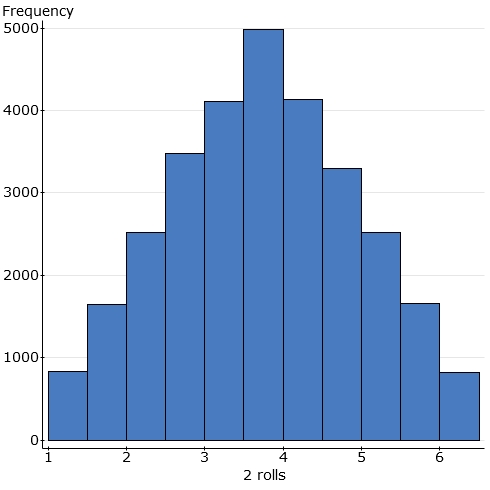
Note that the average of 2 rolls is more likely to be a central value (near
3.5) and less likely to be an extreme value. Precisely because a
1 is just as likely as any other number, two ones in a row producing
an average of 1 would be somewhat unusual. It's more likely that one
largish number will cancel out one smallish number and produce a central
average.
For instance, an average of 1 can only occur from (1+1)/2.� The probability of two 1�s in a row is 1/6 * 1/6 = 1/36.� We can see that it�s comparatively unlikely and only occurs 1/36 of the time in the long run.
Samples of size 3: I'm doing 3 rolls of a fair die to
produce "the average of 3 rolls". I repeat for several thousand
"samples of size 3" and use Statcrunch to display the results:
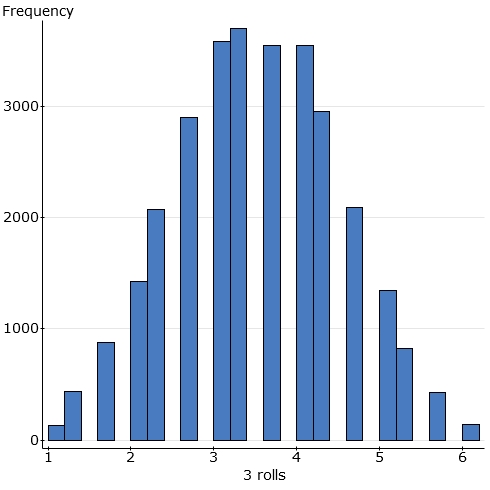
Note that the average of 3 rolls still can�t be that many different
values. But the overall shape is changing. More and more samples
are likely to result in an average closer to the population mean of 3.5
(thought of as the average of all possible rolls of a die).
See how more and more samples are resulting in a central average and fewer and
fewer are resulting in an extreme one. Which is the same as saying, the
average from a sample of size 3 is more likely to result in a central
number, and less likely to result in an extreme one.
For instance, an average of 1 can only occur only from (1+1+1)/3.� The probability of this happening is (1/6) * (1/6) * (1/6) = 1/216.� It is very unlikely, as we can see.
Samples of size 4: I'm doing 4 rolls of a fair die to
produce "the average of 4 rolls". I repeat for several thousand
"samples of size 4" and use Statcrunch to display the results:
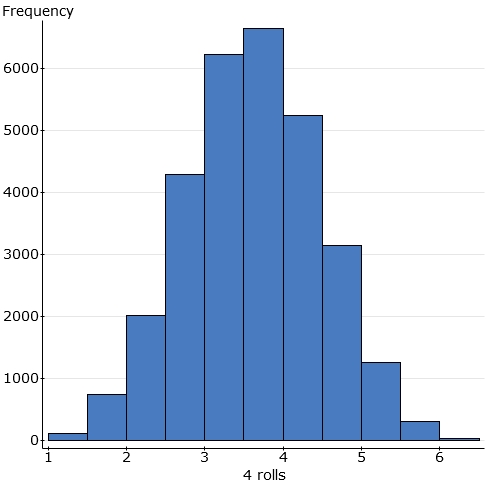
By this time, bars have ceased to represent individual possibilities and now represent ranges of possibilities, because of the limitations of Statcrunch.
Samples of size 5,6, 10, 13, 31:
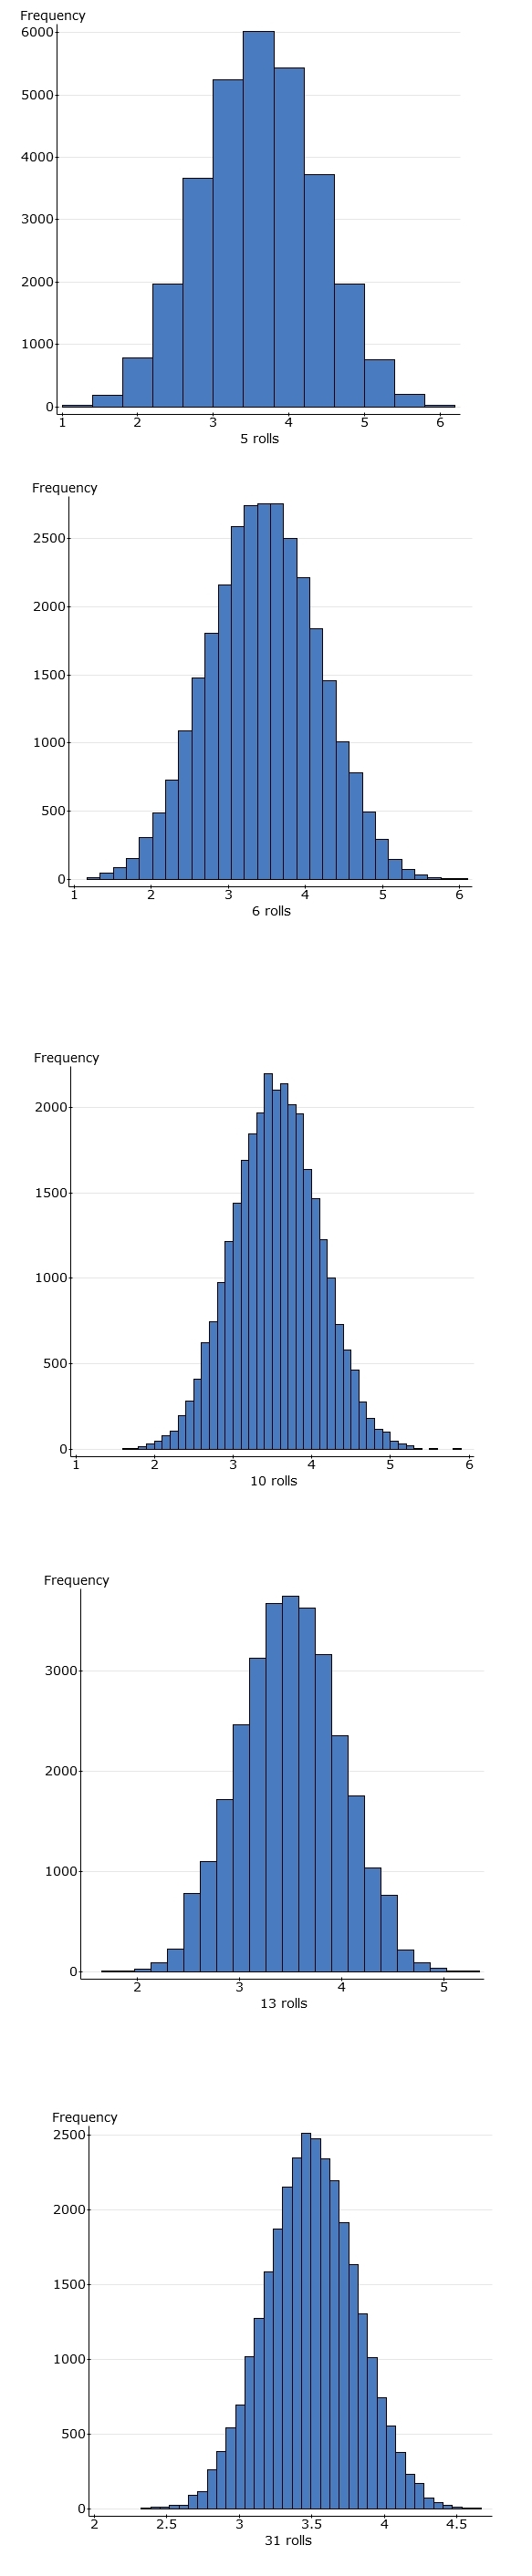
Notice that the extremes of the picture are coming in. Averages near 1 and 6 are now so unlikely that they're not even in the data any longer. For instance an average of 1 (getting 31 ones in a row) is very, very unlikely. It never happens in my thousands of samples that I've generated.
Samples of size 51, 73, 167, 301, 497, 1227, 2076:
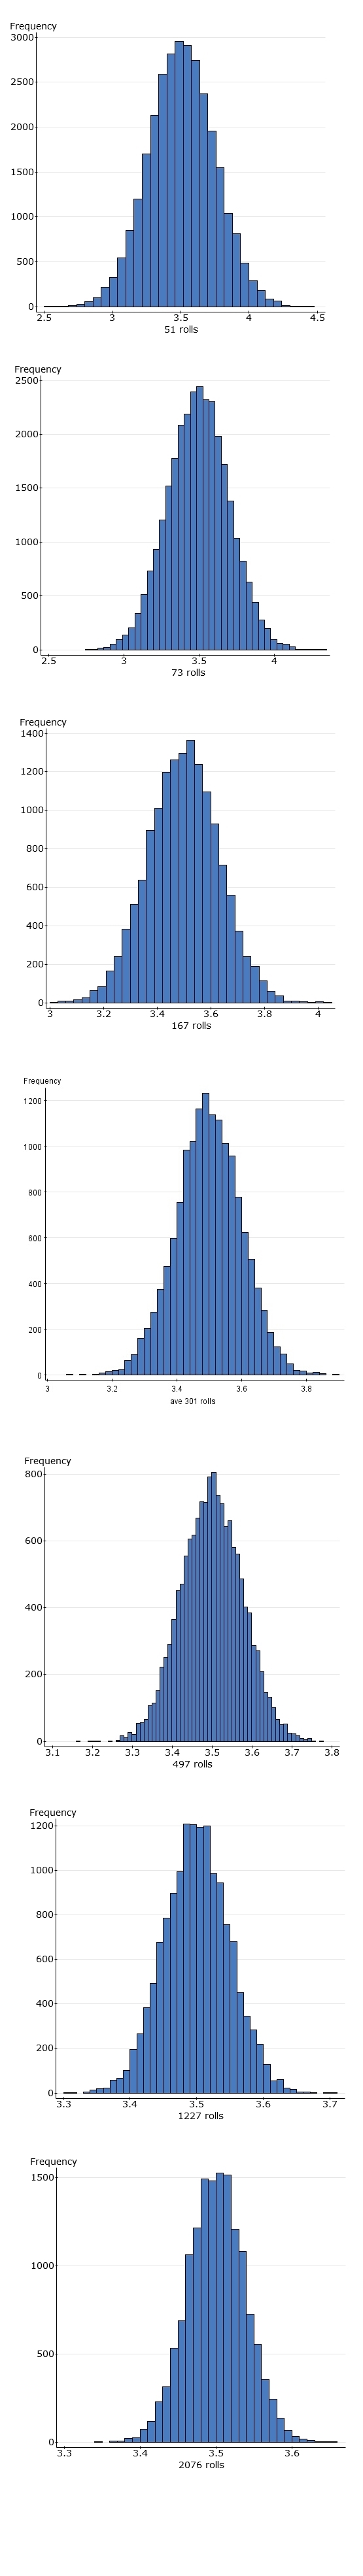
This is the point at which EXCEL begins to implode, but it's enough to
illustrate how the average of a sample size changes pattern as the sample size
gets larger and larger. Note in particular that averages less than 3.3 or
more than 3.7 are now so unlikely that they never occur in
thousands of samples.
A sample of size 1227 is very stable indeed, in what it's likely to
produce. It will very likely be very close to the population average: 3.5
is the "average of all possible rolls of a fair die."
Note that these pictures are not superimposed. That is,
each one is using its own scale. If you superimpose them (note how the
horizontal range is contracting from 1...6 to 3.3...3.7), you'll see
normal-shaped curves getting taller and thinner, but always centered at
3.5.
Note also that after the first three or four pictures, as we have many possible values, the bar ceases to represent an individual possibility and begins to represent a range. The ranges chosen for higher n are somewhat arbitrary; I'm working within the limitations of statcrunch to get the best possible picture.