Global Ozone
After carefully accounting for all of the known natural variations, a net
decrease of about 3% per decade for the period 1978-1991 was found. This
is a global average over latitudes from 66 degrees S to 66 degrees N (i.e. the
arctic and antarctic are excluded in calculating the average). The depletion
increases with latitude, and is somewhat larger in the Southern Hemisphere.
Over the US, Europe and Australia 4% per decade is typical; on the other
hand there was no significant ozone loss in the tropics during this period. The
depletion is larger in the winter months, smaller in the summer. The annual (alternate link) and long-term trends at Caribou, ME.
Between 1991 and 1993 ozone depletion appeared to accelerate. Satellite and ground-based
measurements showed a remarkable decline in stratospheric ozone for 1992 and early 1993, a full 4%
below the average value for the preceding twelve years and 2-3% below the
lowest values observed in the earlier period. By February 1994 ozone over the
United States had recovered to levels similar to 1991. Sulfate aerosols from
the July 1991 eruption of Mt. Pinatubo are the most likely cause of the
exceptionally low ozone in 1993; these aerosols can convert inactive "reservoir"
chlorine into active ozone-destroying forms, and can also interfere with the
production and transport of ozone by changing the solar radiation balance in
the stratosphere. The rapid ozone loss in 1992 and 1993 was a transient
phenomenon, superimposed upon the slower downward trend identified before
1991.
Polar Ozone
Polar regions reflect the greatest changes in ozone concentrations, especially the South Pole. The
topography of Antarctica is such that a stagnant whirpool of extremely cold stratospheric air forms
over the region during the long polar night. The air stays within this polar vortex all winter, becoming
cold enough to allow the formation of polar stratospheric clouds.
The Antarctic Ozone Hole
The springtime Antarctic Ozone Hole was first observed by ground-based
measurements by the British Antarctic Survey from Halley Bay on the
Antarctic coast, during the years 1980-84. (At about the same time, an ozone
decline was seen at the Japanese Antarctic station of Syowa; this was less
dramatic than those seen at Halley since Syowa is about 1000 km further
north, and did not receive as much attention.) With hindsight, one can see the
hole beginning to appear in the data around 1976, but it grew much more
rapidly in the 1980's.
For the past two decades or so, ozone levels over Antarctica have fallen to
abnormally low values between August and late November. At the beginning
of this period, ozone levels are already low, but instead of slowly increasing as
the light comes back in the spring, they drop. In the lower stratosphere,
between 9 and 12 miles (15 and 20 km) altitude about 95% of the ozone is
destroyed. Above 15 miles (25 km) the decreases are small and the net result
is a thinning of the ozone layer by about 50%. In the late spring ozone levels
return to more normal values, as warm, ozone-rich air rushes in from lower
latitudes. The precise duration varies considerably from year to year; in 1990
the hole lasted well into December.
Graphics on the recurring Antarctic Ozone Hole are available. Scroll to bottom of the page at this link for more movies. Temp and height profiles. Also take a look at NASA's Ozone Hole Watch.
The Polar vortex is extremely cold; temperatures in the lower stratosphere
drop below -80 C (about -110 F). Under these conditions large numbers of
polar stratospheric clouds (PSCs) appear in the stratosphere. Type I clouds are composed largely of nitric
acid and water. With even lower temperatures, Type II clouds also form from ordinary
water ice, but these are much less common. PSCs are also
known as nacreous clouds or mother-of-pearl clouds.
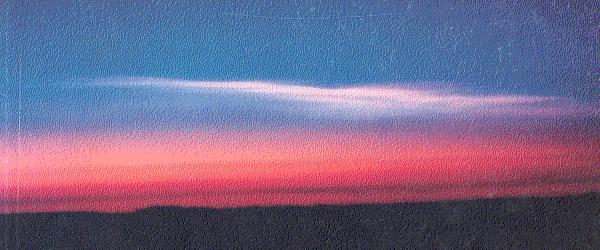 This photograph was taken at an altitude of 39,000 feet from a NASA DC-8
aircraft in the polar region north of Norway during the winter of 1989
and shows clearly the two major types of PSCs that occur in the extremely
cold winter polar stratosphere. Type-I clouds appear in the lower
portion of the photograph as a dark orange or brown layer. Type-II clouds
can be seen as a white formation in the center top.
(Cover photo: Geophysical Research Letters, March 1990 Supplement) More pictures
and a Video
This photograph was taken at an altitude of 39,000 feet from a NASA DC-8
aircraft in the polar region north of Norway during the winter of 1989
and shows clearly the two major types of PSCs that occur in the extremely
cold winter polar stratosphere. Type-I clouds appear in the lower
portion of the photograph as a dark orange or brown layer. Type-II clouds
can be seen as a white formation in the center top.
(Cover photo: Geophysical Research Letters, March 1990 Supplement) More pictures
and a Video
Polar stratospheric clouds speed up the natural process of ozone destruction by providing ice crystal
surfaces on which reactions occur that store chlorine in chemical forms that make ozone very vulnerable
to the arrival of sunlight after the long polar winter night.
The Arctic Ozone "Dent"
The arctic polar vortex is much weaker than the antarctic. Arctic temperatures
are several degrees higher, and polar stratospheric clouds are less common and
tend to disappear earlier in the spring. The arctic vortex can break up and reform several times during the
course of winter. One air mass after another enters the polar darkness and soon emerges back into low
sunshine. Thus, a bit of ozone is lost from each parcel of air, rather than a large amount from one
parcel as in the southern hemisphere. Measurements, however, indicated that
in 1993 arctic stratosphere temperatures stayed low enough to retain PSC's
until late February. Large ozone depletions of about 10-20%, were reported
for high latitudes in the Northern Hemisphere; these still do not qualify as an
"ozone hole" but they do seem to indicate that the same physics and chemistry
are operating, albeit with much less efficiency. The springtime Arctic
ozone "dent" was not noticeable in 1994 nor 1998, but was apparent in the
springs of 1995 and 1997. Arctic Ozone for March 1997-2005 (five day intervals). The biggest Arctic ozone "dent" (maybe even big enough to call a hole?) has just been observed this last spring (2011).
Scientists have been studying the concentration of ozone in the atmosphere since the 1920s. Since then,
instruments have evolved from ground based spectrometers to balloons, aircraft, rockets, and satellites.
Developments in ozone instrumentation have enabled measurements to expand from the atmosphere
above an isolated ground station to daily global coverage and profiles of ozone in the atmosphere.

Ground Based Measurements
Ground stations have been measuring ozone levels for almost a century. They provide long term data of both total
column ozone and ozone distribution with altitude, but only over a small area. Instruments that are
commonly used to measure overhead ozone from the ground are the Dobson
spectrophotometer and Light Detection and Ranging (LIDAR).
Dobson spectrophotometer
 Developed in 1924, the Dobson spectrophotometer is the earliest instrument used to measure ozone,
and modern versions continue to provide data. As of 1993, there were 71 Dobson stations worldwide.
They are the only long term source of ozone data, with one station in Arosa, Switzerland, providing
continuous measurements since the 1920s. Unfortunately, the Dobson method is strongly affected by
aerosols and pollutants in the atmosphere, and measurements are provided only over a small area.
Dobson spectrophotometer measurements are often used to calibrate data obtained by other methods,
including satellites.
Developed in 1924, the Dobson spectrophotometer is the earliest instrument used to measure ozone,
and modern versions continue to provide data. As of 1993, there were 71 Dobson stations worldwide.
They are the only long term source of ozone data, with one station in Arosa, Switzerland, providing
continuous measurements since the 1920s. Unfortunately, the Dobson method is strongly affected by
aerosols and pollutants in the atmosphere, and measurements are provided only over a small area.
Dobson spectrophotometer measurements are often used to calibrate data obtained by other methods,
including satellites.
Dobson spectrophotometers can be used to measure both total column ozone and profiles of ozone in
the atmosphere. Total ozone measurements are made by comparing a frequency of the ultraviolet
spectrum strongly absorbed by ozone with one that is not. Measurements can be based on light from
the sun, moon, or stars. Different techniques enable measurements to be taken in varying weather
conditions and throughout the day.
The vertical distribution of ozone is derived using the Umkehr method. This method relies on the
intensities of reflected, rather than direct, UV light. Ozone distribution is derived from the change in the
ratio of two UV frequencies with time as the sun sets. An Umkehr measurement takes about three
hours, and provides data up to an altitude of 48 km, with the most accurate information for altitudes
above 30 km.
More info on the operation and measurement network of Dobson Ozone Spectrophotometers.
The modern version of the Dobson instrument is the Brewer Spectrophotometer.
LIDAR
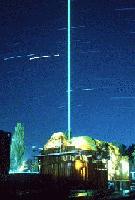 Light Detection and Ranging (LIDAR) is an ozone measurement technique that relies on absorption of
laser light by ozone. A telescope is used to collect ultraviolet light that is scattered by two laser beams -
one of which is absorbed by ozone (308 nm) and the other is not (351 nm). By comparing the intensity
of light scattered from each laser, a profile of ozone concentration vs. altitude is measured from 10 km
to 50 km.
Light Detection and Ranging (LIDAR) is an ozone measurement technique that relies on absorption of
laser light by ozone. A telescope is used to collect ultraviolet light that is scattered by two laser beams -
one of which is absorbed by ozone (308 nm) and the other is not (351 nm). By comparing the intensity
of light scattered from each laser, a profile of ozone concentration vs. altitude is measured from 10 km
to 50 km.
Airborne Measurements
Airborne measurements of ozone provide a direct (or in situ) method of determining ozone
concentrations in the atmosphere. Balloons, rockets, and aircraft carry instruments into the atmosphere,
resulting in the most accurate and detailed methods of measuring ozone. However, the measurements
are made only over localized regions and cannot provide a global picture of ozone distribution.
Balloons
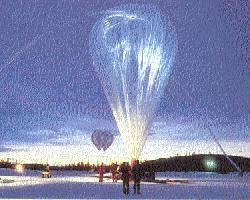 Balloons have been used almost as long as ground devices to measure ozone. They can measure the
change in ozone concentration with altitude as high as 25 miles (40 km) and provide several days of continuous
coverage. Many devices are used to measure ozone from balloons often called Ozonesondes. These include:
Electrochemical Concentration Cells (ECCs), which measure current produced by chemical
reactions with ozone. This method is most common. Photospectroscopy, which uses film or electronic
sensors sensitive to UV light to measure wavelengths affected by ozone. Laser In Situ Sensors,
which measure absorption of laser light projected from the balloon and reflected back to the sensor
from a mirror slung beneath it. Several instruments can be carried at once, so simultaneous measurements of many parameters can be
conducted. Since balloons are unpowered, flight paths cannot be controlled.
Balloons have been used almost as long as ground devices to measure ozone. They can measure the
change in ozone concentration with altitude as high as 25 miles (40 km) and provide several days of continuous
coverage. Many devices are used to measure ozone from balloons often called Ozonesondes. These include:
Electrochemical Concentration Cells (ECCs), which measure current produced by chemical
reactions with ozone. This method is most common. Photospectroscopy, which uses film or electronic
sensors sensitive to UV light to measure wavelengths affected by ozone. Laser In Situ Sensors,
which measure absorption of laser light projected from the balloon and reflected back to the sensor
from a mirror slung beneath it. Several instruments can be carried at once, so simultaneous measurements of many parameters can be
conducted. Since balloons are unpowered, flight paths cannot be controlled.
Rockets
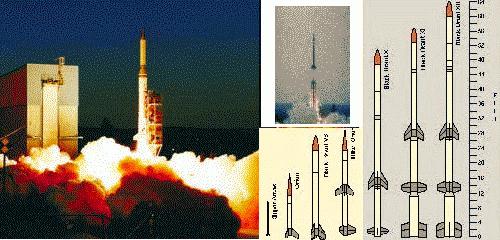 Rockets measure profiles of ozone levels from the ground to an altitude of 75 km by using
photospectroscopy. Rockets provide all weather capability, but are limited by their short life and
narrow geographic range. General info on rocket probes.
Rockets measure profiles of ozone levels from the ground to an altitude of 75 km by using
photospectroscopy. Rockets provide all weather capability, but are limited by their short life and
narrow geographic range. General info on rocket probes.
Aircraft
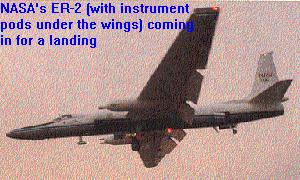 Airplanes are used to make detailed measurements of ozone levels and related chemicals in the
troposphere and lower stratosphere. Typical missions include 10 or more instruments capable of
measuring ozone, chemicals related to the production and destruction of ozone, and atmospheric
conditions that affect ozone. Airplanes are capable of studying chemical reactions and transport
phenomenon which no other platform can study. In 1987 the Airborne Antarctic Ozone Experiment
determined that the ozone hole over Antarctica was caused by anthropogenic chlorine. Measurements from aircraft are restricted by concerns for pilot
safety, range, and flight duration, and are not continuous. They are most useful for the detailed study of
reaction and transport phenomenon in a small area. An interesting video clip of the view from the U-2 in the stratosphere.
Airplanes are used to make detailed measurements of ozone levels and related chemicals in the
troposphere and lower stratosphere. Typical missions include 10 or more instruments capable of
measuring ozone, chemicals related to the production and destruction of ozone, and atmospheric
conditions that affect ozone. Airplanes are capable of studying chemical reactions and transport
phenomenon which no other platform can study. In 1987 the Airborne Antarctic Ozone Experiment
determined that the ozone hole over Antarctica was caused by anthropogenic chlorine. Measurements from aircraft are restricted by concerns for pilot
safety, range, and flight duration, and are not continuous. They are most useful for the detailed study of
reaction and transport phenomenon in a small area. An interesting video clip of the view from the U-2 in the stratosphere.
Satellite Measurements
 Satellites measure ozone over the entire globe every day, providing comprehensive data. In orbit,
satellites are capable of observing the atmosphere in all types of weather, and over the most remote
regions on Earth. They are capable of measuring total ozone levels, ozone profiles, and elements of
atmospheric chemistry.
Satellites measure ozone over the entire globe every day, providing comprehensive data. In orbit,
satellites are capable of observing the atmosphere in all types of weather, and over the most remote
regions on Earth. They are capable of measuring total ozone levels, ozone profiles, and elements of
atmospheric chemistry.
TOMS
The Total Ozone Mapping Spectrometer (TOMS) aboard Nimbus-7 and Meteor-3 provided
global measurements of total column ozone on a daily basis and together provide a
complete data set of daily ozone from November 1978 - December 1994. After an eighteen month period when
the program had no on-orbit capability, ADEOS TOMS was launched on August 17, 1996
and provided data until June 29, 1997. Earth Probe TOMS was launched on July 2, 1996 to provide
supplemental measurements, but was boosted to a higher orbit to replace the
failed ADEOS. Earth Probe continues to provide near real-time data.
Most recent map
UPDATE: As of Jan 1, 2006, global ozone maps are being provided by the Ozone Monitoring Instrument (OMI) aboard the Aura satellite.
A more detailed description about how TOMS measures stratospheric ozone.
For ozone data visit NASA's TOMS Homepage.
Other instruments
For links to other instruments used on
spacecraft platforms click here.